

June 2025 – In a nation where pets are increasingly regarded as family members, the latest data from the American Veterinary Medical Association (AVMA) highlights a continuing evolution in pet ownership and spending habits in the United States. While both dog and cat populations are on the rise, their trajectories—and the ways Americans spend on them—are markedly different.
At the 2024 AVMA Veterinary Economic and Business Forum held virtually October 8–9, AVMA’s assistant director of statistical and data analysis, Maisey Kent, unveiled preliminary findings from the 2024 AVMA Pet Ownership and Demographic Sourcebook. Based on comprehensive surveys of U.S. households conducted in 2023 and early 2024, the data presents a compelling snapshot of how Americans are living with, caring for, and spending on their pets.

A Pet Nation: Soaring Numbers, Especially for Dogs
The U.S. pet population continues to climb, but dogs are leading the charge. After a brief dip in 2023, the dog population rebounded dramatically, reaching an all-time high of 89.7 million in 2024. This is a significant rise from 2023’s 80.1 million and continues a long-term upward trend that began in 1996, when there were 52.9 million dogs.
Cats, while still popular, have grown more slowly. Their population in 2024 reached 73.8 million, up from 59.8 million in 1996. Notably, this remains below the cat population’s peak in 2006 of 81.7 million.
Correspondingly, the number of pet-owning households has also grown, with dog-owning households seeing faster expansion. In 1996, 31.3 million households owned dogs. By 2024, that number had surged to 59.8 million, now accounting for nearly 45.5% of all U.S. households. Cat-owning households grew from 27 million in 1996 to 42.1 million in 2024—now comprising about 32.1% of all U.S. households.
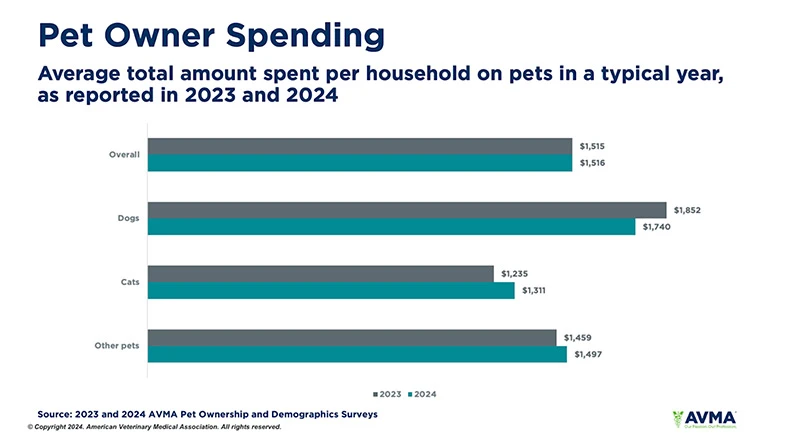
Spending Patterns Shift: Dogs Cost More, But Owners Cut Back
Interestingly, while dog ownership is growing, spending patterns are shifting. On average, dog owners spent less in 2024 than they did in 2023, while cat owners spent slightly more.
The average amount spent on pets—excluding the cost of acquiring them—remained consistent year over year at around $1,515 per household. However, dog owners consistently spent more than cat owners. In 2023 and 2024, the average dog-owning household spent over $1,700, while cat owners spent under $1,350.
Veterinary care remains a major expenditure, accounting for about one-third of total pet-related spending. Still, overall veterinary spending declined 4% between 2023 and 2024. For dog owners, the average annual veterinary cost fell 7% to $580. Cat owners, however, spent 6% more, averaging $433 in 2024.
The average cost of a veterinary visit also dropped—from $190 in 2023 to $147 in 2024. For dogs, visits were costlier: $265 in 2023 and $214 in 2024. Cat visits were notably less expensive, at $163 in 2023 and $138 in 2024.
Veterinary Visits: High Satisfaction, But Cost Remains a Concern
While most pet owners report positive interactions with veterinary teams, cost remains a sticking point. In 2024, between 62% and 65% of dog and cat owners said they were “extremely satisfied” with their veterinarian, technicians, and staff. However, only 28.2% expressed the same level of satisfaction with veterinary costs.
Routine checkups or preventive care were the most common reasons for veterinary visits—nearly 80% for both dogs and cats. Yet, a growing number of owners are skipping the vet altogether. In 2024, 22.8% of dog owners and 31.1% of cat owners said they didn’t spend anything on veterinary care because their pet “did not need a checkup.” Those figures rose sharply from 12.3% and 17.4%, respectively, in 2023.
Over a quarter of cat owners reported zero annual spending on veterinary care, compared with less than 15% of dog owners. Kent advised veterinary practices to pay close attention to client satisfaction metrics and to improve visit experiences—especially the checkout process—to retain and better serve clients.
Who Are Today’s Pet Owners?
Demographics also reveal differences in dog and cat owner profiles. The most common household income range for dog owners was $50,000–$74,999, while cat owners most frequently reported incomes of $30,000 or less.
Despite financial differences, the emotional bond is universally strong: 88.8% of dog owners and 84.7% of cat owners consider their pets full-fledged members of the family.
A notable behavior gap also exists in veterinary engagement. In 2024:
-
86.8% of dog owners said they had a regular veterinarian.
-
74.2% of dog owners had visited a vet in the previous year.
-
For cats, 77.1% had a regular vet, but only 57.3% visited one.
Even among those who do visit, frequency varies:
-
56.5% of dog owners visited the vet twice in 2024.
-
44.9% of cat owners went just once.
Final Thoughts: A Growing Pet Economy with Shifting Priorities
As America’s pet population continues to expand, the AVMA’s 2024 report shows both growth and growing pains in the pet economy. While more households than ever include dogs and cats, and most consider their pets family, cost-consciousness is clearly shaping behavior—particularly around veterinary care.
Maisey Kent concluded with a call to action for veterinarians: “It’s essential for practice leaders to understand what drives client satisfaction and find innovative ways to improve the entire veterinary experience.”
The full 2024 AVMA Pet Ownership and Demographic Sourcebook is now available. AVMA members can access it for free, while nonmembers may purchase it for $375. The report includes in-depth data on pet demographics, veterinary visits, owner income, spending habits, and more—offering vital insights for industry professionals navigating a changing landscape of pet care.
For more information, visit www.avma.org.


Leave a Reply