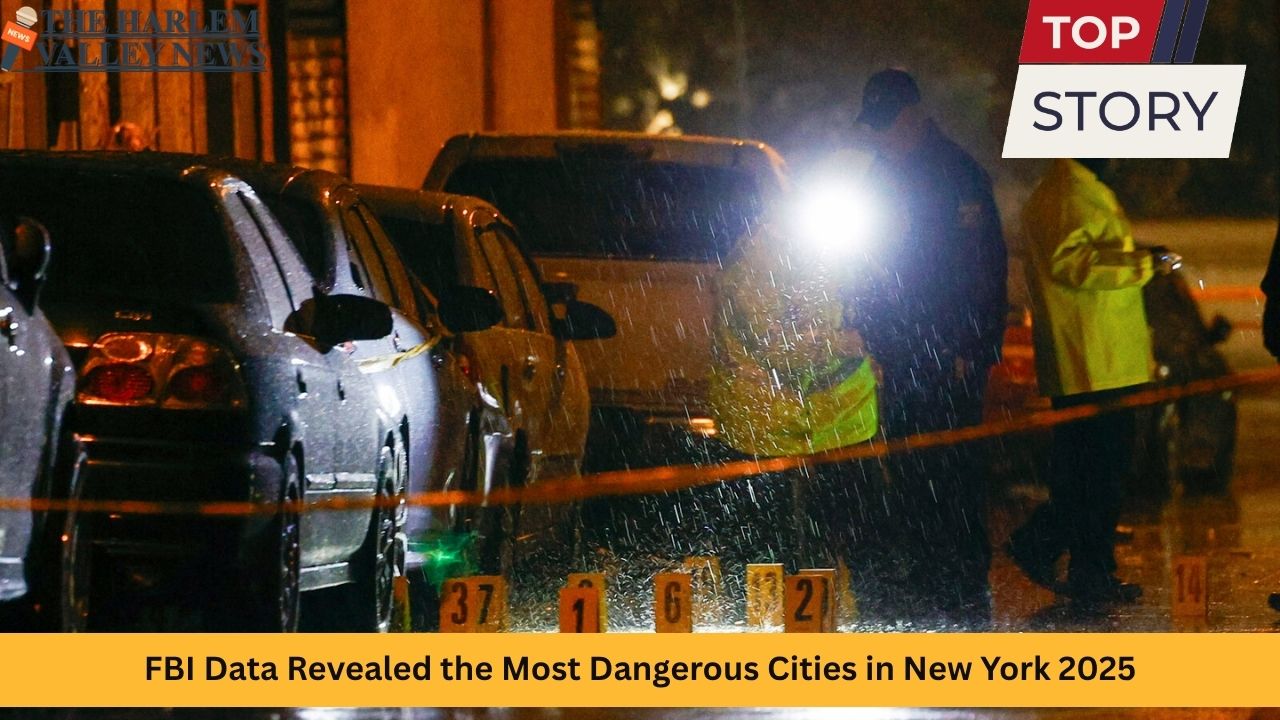
The state of New York is a tapestry of diverse communities—booming metros, historic towns, vibrant suburbs, and sprawling rural areas. It is also home to some of the nation’s most heavily monitored neighborhoods for crime trends and patterns. With the latest FBI crime data and state law enforcement statistics for 2025, a distinct map of safety and danger emerges across New York’s cities.
This comprehensive guide explores the most dangerous cities in New York for 2025, spotlighting crime rates, population dynamics, and the social and economic factors swirling around these communities. The article offers nuanced insight into the causes of elevated crime, what each city is doing in response, and practical safety tips for both residents and visitors.
Understanding New York’s Crime Landscape
To decipher what makes a city “dangerous,” crime rates per 1,000 residents are utilized, focusing on metrics like violent crime (murder, rape, robbery, aggravated assault) and property crimes (burglary, larceny, vehicle theft). These numbers are paired with local context: economic distress, population size, and unique dynamics such as tourism, university presence, or patterns in gang activity.
Crime rates in New York fluctuate significantly. While New York City remains far safer than in decades past, several upstate urban centers still experience crime rates well above national and state averages. Suburbs and small towns, by contrast, often report some of the lowest crime rates nationally.
The Most Dangerous Cities in New York
Buffalo
Buffalo leads the list of New York’s most dangerous cities in 2025, with violent crime rates nearly triple the state average. Key statistics include:
-
Violent crime rate: approximately 12.4 incidents per 1,000 residents.
-
Property crime rate: around 42.6 per 1,000 residents.
Buffalo’s East Side accounts for almost half of the city’s shootings, and robberies are most common downtown. While recent years have seen notable police initiatives such as drone-assisted patrols—cutting response times and improving apprehension rates—systemic issues like concentrated poverty, abandoned homes, and youth gang recruitment remain persistent challenges. Nonetheless, community programs have eased some pressures, resulting in a reduction in certain youth crimes and gradual improvements in overall safety.
Rochester
Rochester stands close behind, facing entrenched criminal activity as well as socio-economic headwinds.
-
Violent crime rate: about 11.8 per 1,000 residents.
-
Property crime rate: roughly 40.2 per 1,000.
Many violent incidents occur in the city’s northeast such as aggravated assaults, while carjackings are common along major arteries like I-490. Efforts to enhance safety—like public housing security camera installations—have decreased burglaries, though challenges remain, especially where drug trafficking and gang violence intersect in vulnerable neighborhoods.
Syracuse
Syracuse marks another urban area grappling with persistently high crime:
-
Violent crime rate: approximately 10.2 incidents per 1,000.
-
Property crime rate: about 38.4 per 1,000.
The Southside is consistently the most affected, with a large percentage of violent offenses occurring near older, often abandoned industrial areas. In response, increased law enforcement presence and the deployment of technology such as surveillance cameras downtown have had an impact. Police task forces have also successfully seized significant numbers of illegal firearms.
Niagara Falls
Famous for its natural beauty and tourism, Niagara Falls also contends with elevated crime, especially property offenses.
-
Violent crime rate: 9.3 per 1,000.
-
Property crime rate: 36.1 per 1,000.
Seasonal theft surges commonly occur in tourist-heavy periods, and incidents are particularly prevalent along major strips and around hotels. The city has enhanced lighting in key sectors and partnered with private security in the hospitality industry, resulting in notable drops in certain types of crime, though core challenges persist.
Albany
The capital city of New York balances crime-fighting advancements with longstanding difficulties.
-
Violent crime rate consistently above the state average.
-
Property crimes remain a concern, especially burglary and larceny.
Downtown Albany and some northern neighborhoods frequently report the highest incident counts. Law enforcement has introduced foot patrols and invested in community partnerships, which have helped dampen some of the crime surges observed in past years.
Binghamton
Binghamton, in Broome County, appears frequently in state-level assessments of high-crime cities:
-
Property and violent crime rates that outpace many other New York cities.
-
Issues like drug trafficking and petty crime are prevalent.
Notably, the city’s compact geography means that crime often affects multiple neighborhoods at once, putting increased stress on local services. Major steps, including school-outreach programs and new strategies targeting repeat offenders, are underway.
Utica
Utica’s position as a regional industrial hub has brought population regeneration alongside recurring safety concerns.
-
Violent crime rate: around 4.9 per 1,000.
-
Property crime rate: approximately 32.4 per 1,000.
Revitalization efforts in the downtown area have contributed to some progress, but persistent poverty, substance abuse, and organized criminal activity remain obstacles.
Watertown
Watertown distinguishes itself with population size but carries a level of property crime three times the state average and double the national figure.
-
Property crime rate: near 36.3 per 1,000.
-
Violent crime rate: about 4.4 per 1,000.
Crimes concentrate near the city center and adjacent commercial corridors. Law enforcement has turned to community policing, neighborhood revitalization, and surveillance technology to counter these trends.
Troy
Troy’s charming riverfront masks underlying issues:
-
A steady stream of larceny, burglary, and robbery, primarily downtown and close to college campuses.
-
High population mobility due to students and renters adds complexity to safety efforts.
Schenectady
Schenectady, not far from Albany, struggles with elevated violent and property crime. Key drivers include an aging housing stock, transient populations, and pockets of economic disadvantage.
New York City: A Unique Case
While New York City is not the most dangerous city in the state, it cannot be left out. Its immense size, density, and complexity mean its statistics shape statewide and even national perceptions.
In 2025, New York City experienced record lows for shootings and homicides. From January to May, there were 264 shootings and 112 murders—historically low figures compared to earlier years. Felony assaults, robbery, burglary, and grand larceny saw notable declines, with the city reporting an eighth consecutive month of reduced major crime categories.
However, there’s a nuanced picture: while the city’s violent crime is at record lows, other crime categories, such as car thefts and felony assaults, rose from pre-pandemic levels. Public perception sometimes diverges from official crime rates, with many New Yorkers still reporting feeling less safe, especially regarding subway crime and neighborhood-specific incidents.
Notably, neighborhoods traditionally seen as high-risk—such as Brownsville (Brooklyn), the South Bronx, East Harlem, Bedford-Stuyvesant, Jamaica (Queens), and parts of East New York—continue to post some of the city’s highest crime rates, driven by economic hardship and cycles of disadvantage.
Factors Driving Crime in New York’s Most Dangerous Cities
Several persistent and emerging factors interweave to influence crime rates in New York’s dangerous cities:
-
Economic Disparities: High unemployment and underemployment, lagging wages, and economic uncertainty contribute to feelings of desperation in many communities, sometimes fueling crime.
-
Population Shifts: Cities with shrinking or rapidly changing populations struggle to adapt infrastructure and social services, leading to pockets of neglect and instability.
-
Drug Trade and Substance Abuse: The opioid and synthetic drug epidemics have hit many upstate cities hard, with accompanying spikes in property crime and violence due to addiction-related behaviors.
-
Gang and Youth Violence: Youth gang recruitment is a particular concern in Buffalo, Rochester, and parts of New York City.
-
Tourism and Transient Populations: Cities like Niagara Falls see crime spikes tied to tourism seasons, while college towns face unique problems related to larger transient student populations.
-
Infrastructure and Housing: Deteriorating or abandoned properties are frequently tied to higher crime, especially violent crime.
Government and Community Responses
Efforts to combat crime across these cities range from traditional policing to innovative community programs.
-
Technology-Driven Policing: Deployment of drones, enhanced CCTV networks, and real-time analytics have helped cities like Buffalo and New York City respond more quickly to incidents.
-
Community Engagement: Cities such as Rochester and Syracuse invest in outreach programs, collaborating with schools, churches, and neighborhood coalitions to address root causes.
-
Gun Control Initiatives: Major New York cities have removed thousands of illegal firearms from circulation, supporting ongoing declines in shootings and murders.
-
Economic Revitalization: Many upstate cities are investing in urban renewal projects, workforce training, and social services with the aim of curbing poverty-driven crime long-term.
-
Tourism and Public Safety Partnerships: Hotspots like Niagara Falls work with hotels and local businesses to tighten security during tourist peaks.
Comparative Table: Key Crime Metrics in New York’s Most Dangerous Cities (2025)
| City | Violent Crime Rate (per 1,000) | Property Crime Rate (per 1,000) | Notable Crime Trends |
|---|---|---|---|
| Buffalo | 12.4 | 42.6 | Shootings; robberies; youth gangs |
| Rochester | 11.8 | 40.2 | Assaults; carjackings; drug crimes |
| Syracuse | 10.2 | 38.4 | Illegal firearms; thefts; gang issues |
| Niagara Falls | 9.3 | 36.1 | Theft spikes; hotel crime |
| Albany | Above state avg. | Burglary & larceny high | Downtown crime; foot patrol efforts |
| Binghamton | Above state avg. | Above state avg. | Drug trafficking; repeat offenses |
| Utica | 4.9 | 32.4 | Downtown crime; substance abuse |
| Watertown | 4.4 | 36.3 | Central property crime concentration |
| Troy | Elevated | Larceny, robbery issues | Student population effect |
| Schenectady | Elevated | Elevated | Transient populations, older housing |
Rates are estimates for 2025 and represent general trends.
Safety Tips for Residents and Visitors
If you live in or travel to New York’s high-crime areas, the following strategies can enhance your safety:
-
Remain alert in unfamiliar or high-risk neighborhoods, especially after dark.
-
Secure parked vehicles, avoid leaving valuables in sight, and use garage or monitored lots where possible.
-
Engage with local safety alerts via city apps or police department updates.
-
Utilize reputable taxi and rideshare providers, particularly in areas known for robberies or carjackings.
-
Stay in well-lit, populated areas and avoid abandoned or blighted properties.
-
Support or participate in community watch programs to help build safer neighborhoods.
A Dynamic Landscape
Crime rates are not static. As cities invest in technology, forge key community partnerships, and address core drivers like poverty and drug abuse, many dangerous neighborhoods are seeing glimmers of renewal. New York City, once a symbol of urban crime, now stands as one of the safest big cities worldwide—though localized challenges persist.
Buffalo, Rochester, and Syracuse remain at the top of the list not by inevitability, but due to a convergence of tough-to-crack problems. Data through 2025 reveal some progress, a testament to the resilience of New Yorkers and the efforts of local leadership.
Looking Forward
Monitoring the most dangerous cities in New York is about more than statistics—it’s a lens on urban life, social change, and the enduring quest for safer, more equitable communities. As New York’s cities continue to modernize policing, invest in revitalization, and foster stronger connections between residents and authorities, the hope is that the “dangerous city” label will slowly become a thing of the past.
Those planning to visit or relocate to New York should explore these trends in detail but should also recognize that even its riskiest cities are home to vibrant communities working tirelessly on behalf of their own security and shared future. For every crime headline, there are countless acts of heroism, community, and recovery, making New York’s story far richer than any statistics alone could ever tell.
- https://www.nyc.gov/site/nypd/stats/crime-statistics/citywide-crime-stats.page
- https://www.fbi.gov/how-we-can-help-you/more-fbi-services-and-information/ucr
- https://www.criminaljustice.ny.gov/tableau_index_crime.htm
- https://cde.ucr.cjis.gov
- https://counciloncj.org/crime-trends-in-u-s-cities-year-end-2024-update/
- https://reolink.com/blog/most-dangerous-cities-in-new-york/
- https://www.nytimes.com/2025/04/03/nyregion/nyc-shootings-decrease-first-quarter.html
- https://www.nyc.gov/site/nypd/stats/crime-statistics/historical.page
- https://www.buildingsecurity.com/blog/the-most-dangerous-neighborhoods-in-nyc/
- https://www.nyc.gov/site/nypd/news/pr010/nypd-record-low-shootings-murders-the-first-five-months-2025
- https://www.bloomberg.com/opinion/articles/2025-05-28/why-has-new-york-city-defied-the-great-american-crime-decline
- https://www.travelsafe-abroad.com/most-dangerous-cities-in-new-york/
- https://www.politico.com/news/2025/05/08/eric-adams-touts-a-drop-in-crime-the-numbers-tell-a-different-story-00334274
- https://www.fbi.gov/news/press-releases/fbi-releases-2024-quarterly-crime-report-and-use-of-force-data-update
- https://economictimes.com/nri/visit/these-are-the-most-dangerous-cities-in-2025/articleshow/122859926.cms
- https://abc7ny.com/post/nypd-crime-stats-chief-department-john-chell-touts-decrease-shootings-homicides-2025/16660312/
- https://www.criminaljustice.ny.gov/crimnet/ojsa/stats.htm
- https://getsafeandsound.com/blog/most-dangerous-city-in-america/
- https://www.arcgis.com/apps/instant/sidebar/index.html?appid=8153f961507040de8dbf9a53145f18c4
- https://www.brennancenter.org/our-work/research-reports/us-crime-rates-and-trends-analysis-fbi-crime-statistics


Leave a Reply